
Under ANALYSIS – ADVANCED, the “Activities – Daily Values – Monitoring” dashboard is available to you, provided your club has activated the “Training Module”. You can use this dashboard to analyze and visualize your training data.
Under “Date Range”, select the time period you want to analyze.
Dashboard
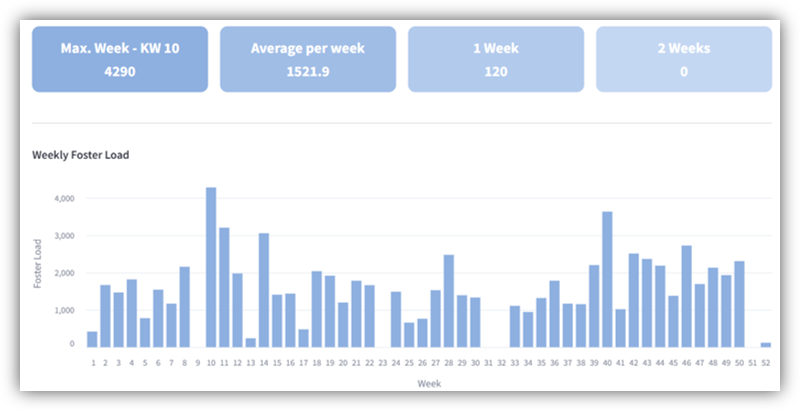
Under “Weekly Foster Load”, you’ll find a weekly overview of your reported foster load. The graph shows the total foster load for each week.
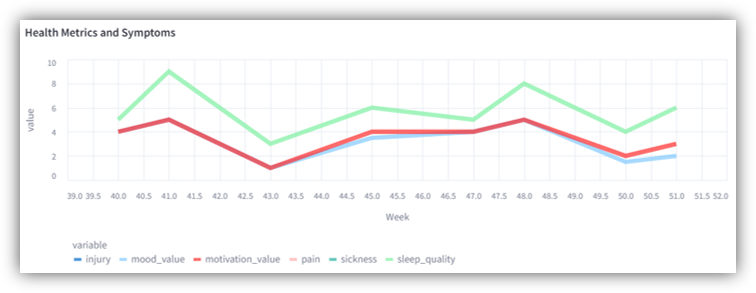
Further down, under “Health Metrics and Symptoms”, you’ll see your daily values. The graph shows how your reported motivation, mood, and sleep quality have changed over the course of the week. Your reported injuries, pains, and illnesses are also displayed.
Load (ATL/CTL/ACWR)
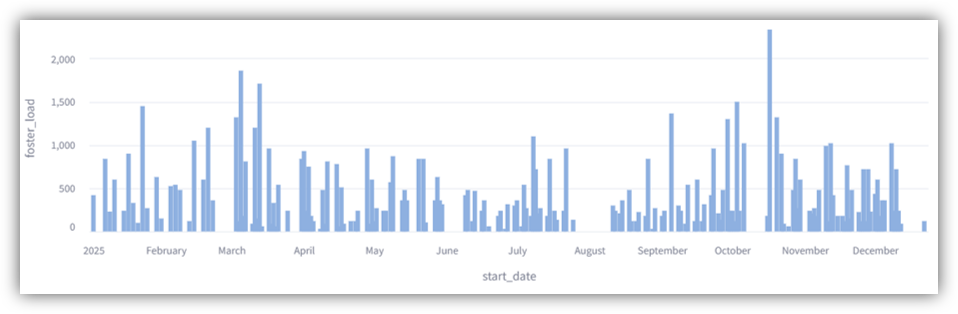
Under “Foster Load”, you can see every single Foster Load you’ve reported. When you hover your mouse over a bar in the graph, the date and the exact value will be displayed.
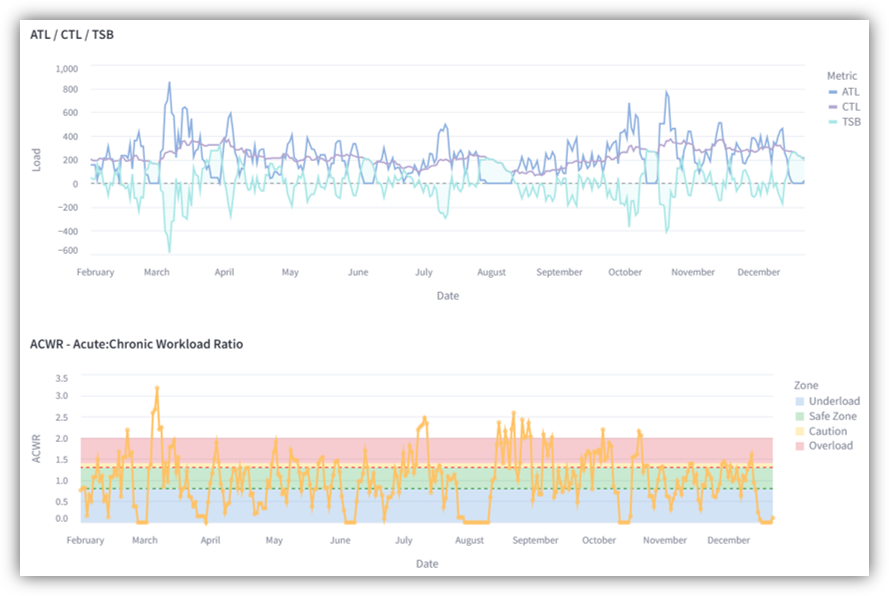
The “ATL / CTL / TSB” graph displays the three parameters ATL (Acute Training Load), CTL (Chronic Training Load), and TSB (Training Stress Balance). These parameters help you monitor and adjust your training load, recovery, and fitness level. You can view the exact values by hovering your mouse over them.
In addition, the “ACWR – Acute Chronic Workload Ratio” is displayed. At the very bottom, you can access explanations for all of these values.
Further down, the charts “Mood, Motivation, and Sleep Quality” and “Pain, Illness, and Injury” show how these daily values change. You can zoom in and out of the chart to view only specific days, for example.
Activities
Here you can see how often each type has been covered (number of training hours). In the two charts on the left and right, you can hide specific types. Simply click on the type in the list to hide it.
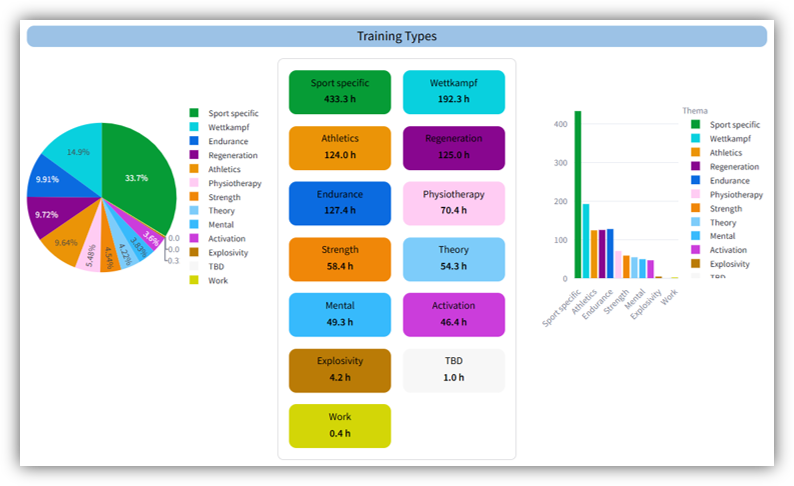
Further down, under “Combination of types and methods”, you’ll find an overview of all types covered in combination with the respective methods. All possible combinations of types and methods are displayed.
Under “Only Methods”, you can view all methods that have been used. An “*” indicates that no specific method was selected for those training sessions. Using the “Without * methods” slider, you can hide these training sessions so that the graph shows only the methods that were actually used.
Week/Months
Here, you can view the number of hours completed per week or month in a bar chart organized by type. Click on a type in the legend on the right to display only that specific type.
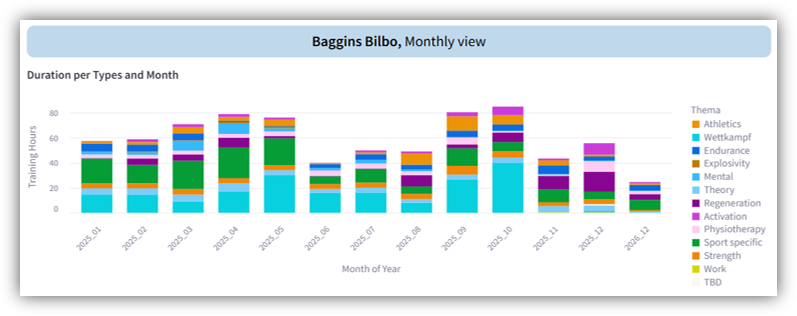
Further down, under “Chart per day”, you can view the completed types for each individual day.
In the “Chart/Duration per method” section, all methods are broken down by week or month. Using the “Without * methods” slider, you can hide the hours without a selected method so that the chart shows only the methods that were actually used.
Properties
If additional properties have been added for activities or exercises, they can be analyzed here.
In the “Activity Properties” tab, select the property you want to analyze. For the selected property, the system displays how often it was used in activities. You also have access to a weekly overview and a breakdown by type.
In the “Numeric Values” tab, you can analyze numeric properties using a selected filter.
If the exercises used the predefined properties, you’ll find the corresponding analyses in the “Exercise Analysis” tab. Select the desired property at the top to view the total count per exercise. A comparison between the planned and actual values (based on your feedback) is also displayed.
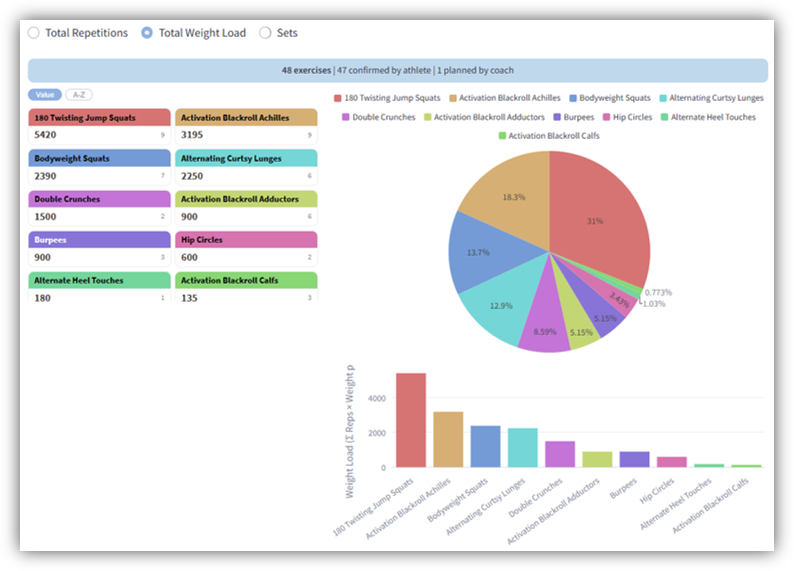
In the “Exercise Properties” tab, you can analyze the custom properties that have been added to the exercises.
Under “Exercise Clusters”, you can group multiple exercises into a single cluster. In the various analyses, the results are then displayed at the cluster level. Click “Add Cluster” to create a new cluster. Enter a name, select a color, and select all the exercises you want to assign to this cluster.
Planning
Here you can view your calendar in weekly or monthly view. If you have events scheduled with multiple clubs or federations, the respective dates will be highlighted in different colors.