
Under “Settings” on the left, select one or more athletes you want to analyze, as well as the desired time period.
Dashboard
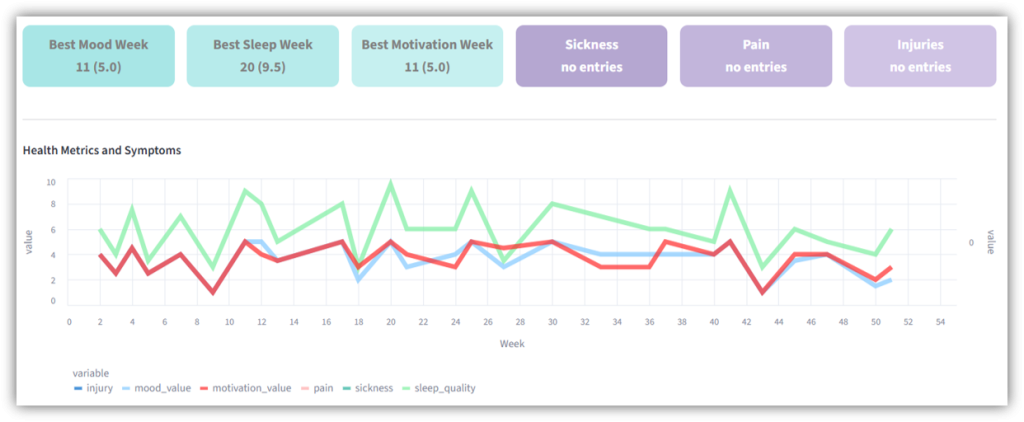
Under “Weekly Foster Load” you will find a weekly overview of the reported Foster Load of your athletes. The graph shows the total Foster Load for each week.

Further down, under “Health Metrics and Symptoms”, you can see the daily values of your athletes. The graph shows how the reported motivation, mood and sleep quality have changed over the course of the week. The reported injuries, pain and illnesses are also visible. The weekly totals of all values are displayed.
Load Monitoring
Under “Foster Load” you can see every single reported Foster Load of your athletes. If you move your mouse over a bar in the graph, you will see the day and the exact Foster Load.
Further down, the graphs “Health Metrics” and “Pain, Sickness and Injury” show the change in these daily values. You can zoom in and out of the graph to display only certain days, for example.
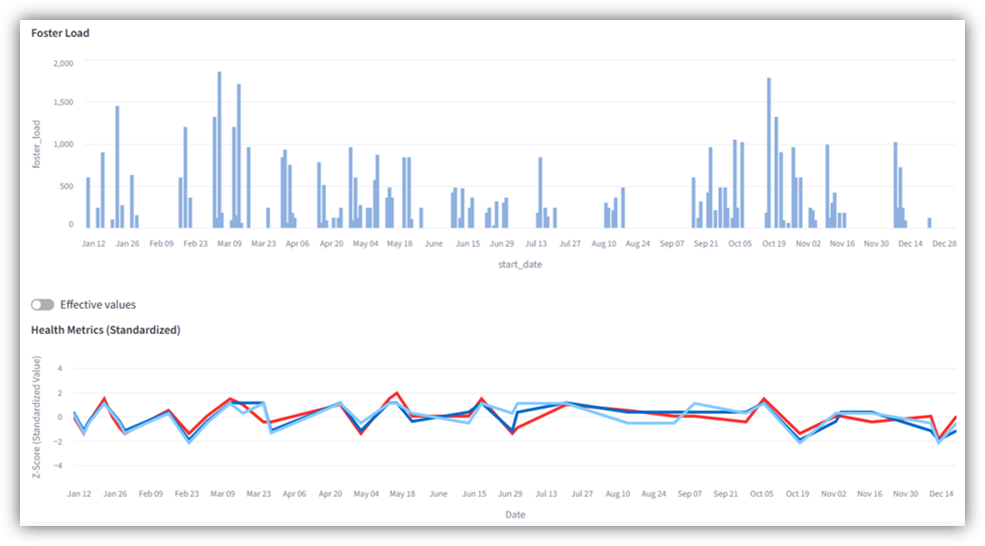
With the “Effective values” slider, you can display the effective values of the individual daily values.
ATL CTL
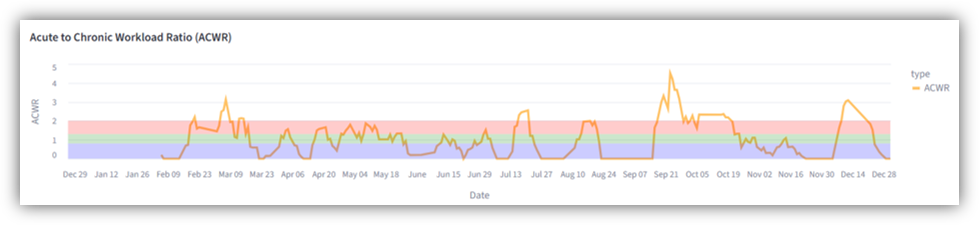
This graph shows you the three parameters ATL (Acute Training Load), CTL (Chronic Training Load) and TSB (Training Stress Balance). These parameters help you to monitor and adjust your training load, recovery and fitness level. You can zoom in and out of the graph and display the exact values by moving the mouse over them.

In addition, the “Acute to Chronic Workload Ratio (ACWR)” is displayed. Further down, you have the option of viewing explanations of all these values.
Planning
Here you can see the calendar of the selected athlete in daily, weekly, or monthly view. If the athlete is scheduled in several clubs or federations, the respective dates are displayed in different colors.
With the “Planning Overview next 31 days” slider, you can specify whether you want to see future planning (slider turned on) or past planning (slider turned off).